Features
Activity detail
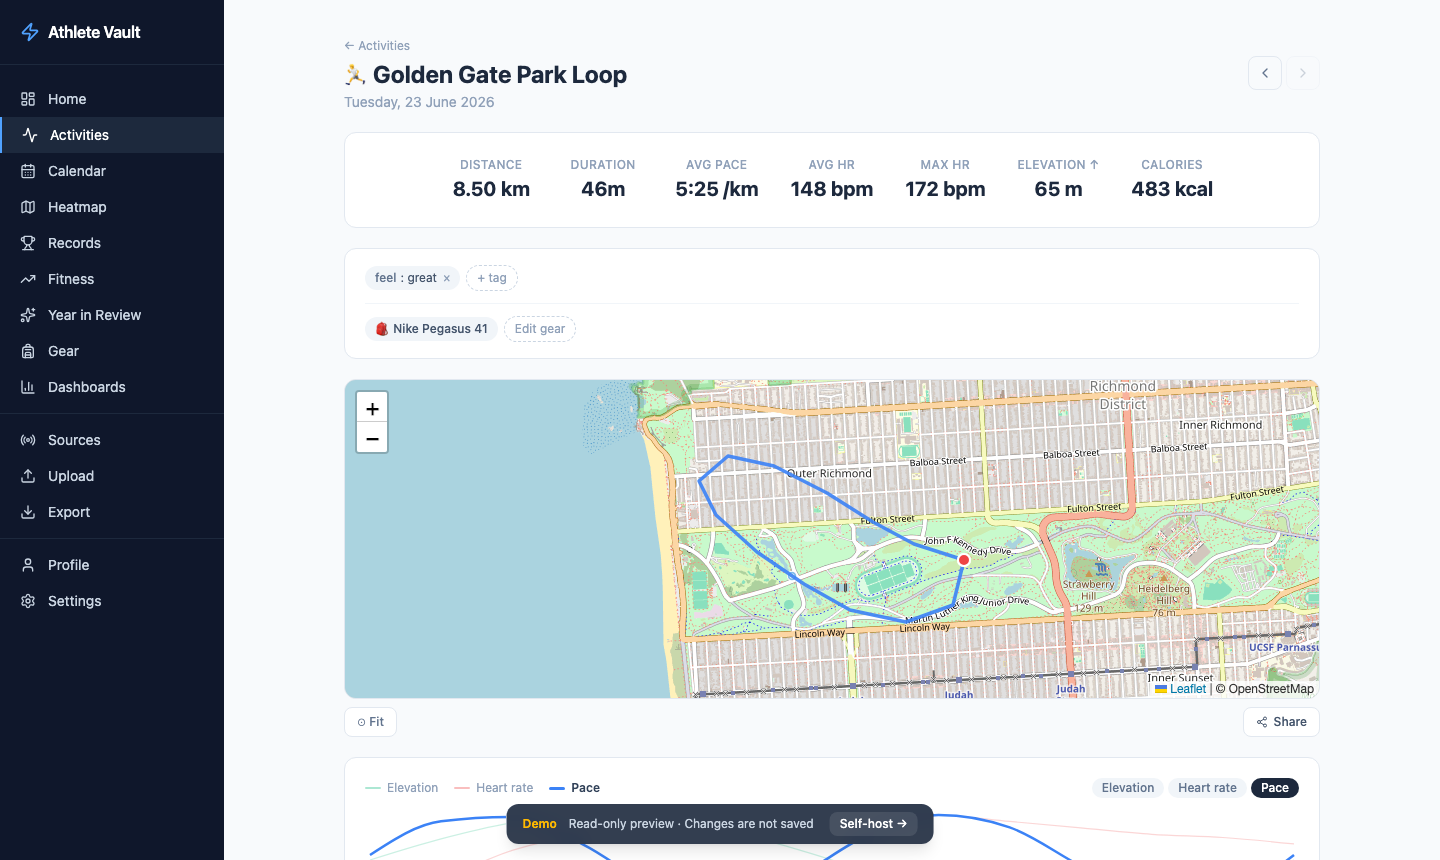
Each activity page shows everything about a single workout.
Stats header
Distance · moving time · average pace · average & max HR · elevation gain · calories — all unit-aware (switch between metric and imperial in Settings).
A weather chip appears when the activity has GPS data: temperature, wind speed, and a description fetched once from the Open-Meteo archive API and cached in the database.
Route map
GPS track rendered on a full-width map with start (green) and finish (red) markers. Choose from multiple map styles:
- OSM — OpenStreetMap raster tiles
- CartoDB — clean greyscale raster
- Protomaps Light / Dark / White / Greyscale — vector tiles served from your own or a hosted Protomaps key; fast and offline-capable
Hover any chart point to move a crosshair marker to that exact position on the map.
Charts
Up to four simultaneous Recharts panels. Available metrics: pace, heart rate, elevation, cadence. A metric picker above each chart lets you swap without reloading.
Auto splits
A per-km (or per-mile) split table computed directly from raw GPS samples — no device lap button required. Each split shows pace, average HR, and elevation delta. Toggle between km and mile splits with a single button.
Comparable efforts
A "Similar routes" card appears when two or more activities share approximately the same route (bounding box centroid within ~1 km, distance within ±20%). The table shows date, distance, pace, HR, and a "vs your best" pace delta coloured green or red.
Notes
A free-text notes field sits below the stats. Type anything — race report, how your legs felt, conditions — and it saves automatically when you click away. Notes are searchable and persist across syncs.
Tags
Attach key/value tags to any activity (e.g. surface: trail, effort: easy). Tags are displayed as chips and can be added or removed at any time without affecting synced data.
3D flyover
Click 3D Flyover on any activity with GPS data. The map tilts to 62°, follows the route at 15.5× zoom with terrain exaggeration, and animates the camera along the path. Speed is adjustable (0.5×, 1×, 2×). Stop at any point — the map returns to a flat bird's-eye view.
Requires a Protomaps key (vector tiles provide the terrain layer). Falls back gracefully on raster tile styles.
Share card
Click Share to open the share card modal. Choose from three aspect ratios (16:9 landscape, 9:16 portrait, 1:1 square) and three themes (dark, light, transparent). The card includes the route map, key stats, and activity name — export as PNG with one click.
Laps table
Per-lap summary imported from your device: index, distance, pace, average HR.
Gear
Assign shoes, bikes, or other equipment directly from the activity page. Assignments appear immediately in the Gear page totals.
Heatmap
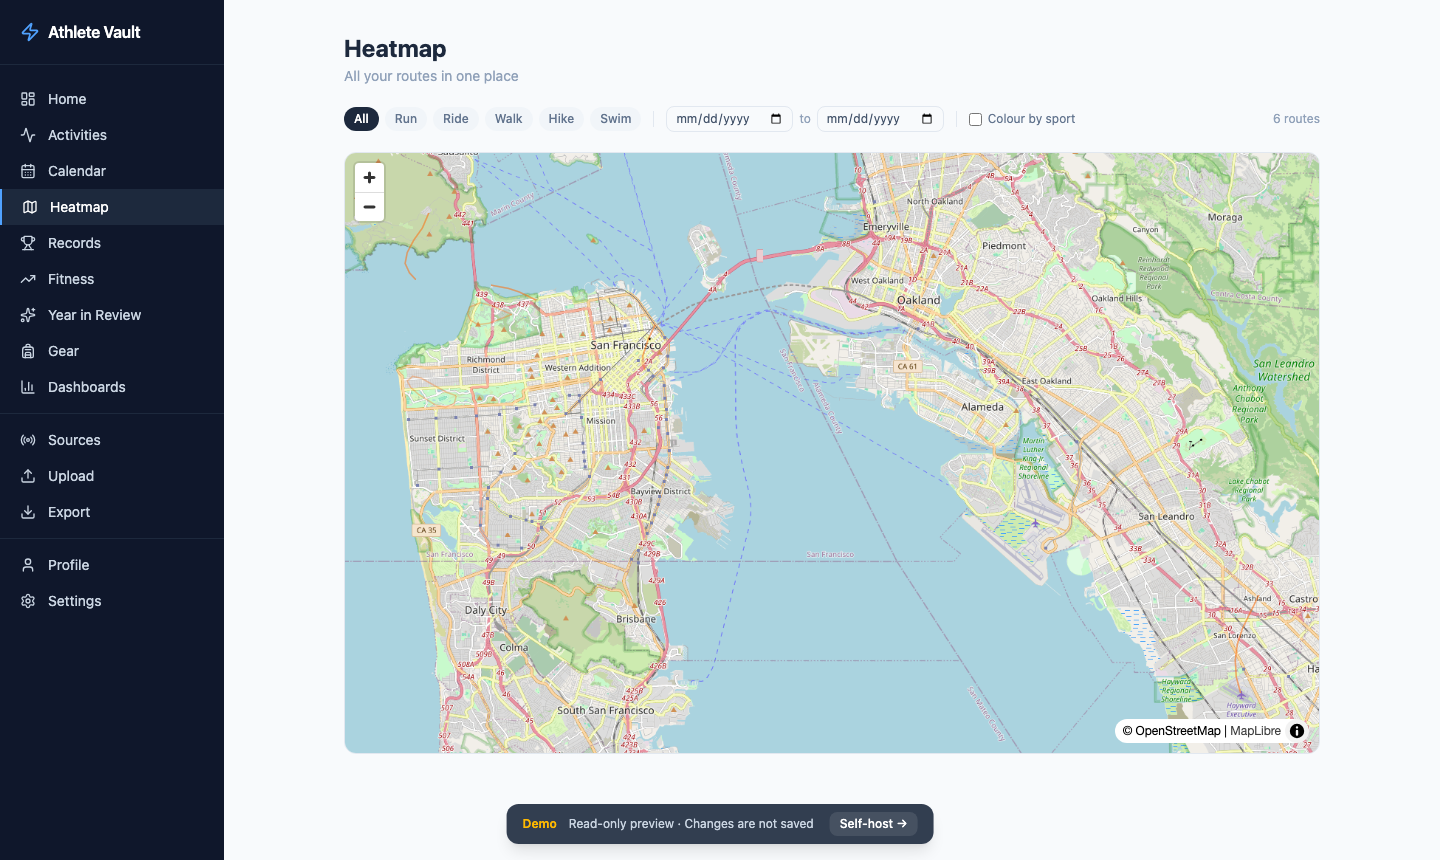
Every GPS route overlaid on one map. Dense areas appear brighter due to overlapping semi-transparent lines.
- Sport filter — isolate runs, rides, or any single sport type
- Date range — narrow to a specific period
- Map style — all the same styles as the activity detail map
The heatmap GeoJSON is computed once and cached in memory; re-cached whenever new activities arrive.
Training Calendar
Monthly grid showing all activities. Spot training consistency and rest days at a glance.
- Each day cell is coloured by sport type; height scales with total distance
- Click a day to expand and see all activities logged that day
- Navigate month by month
- Streak overlay — current and best streaks shown in the header
Fitness (Performance Management Chart)
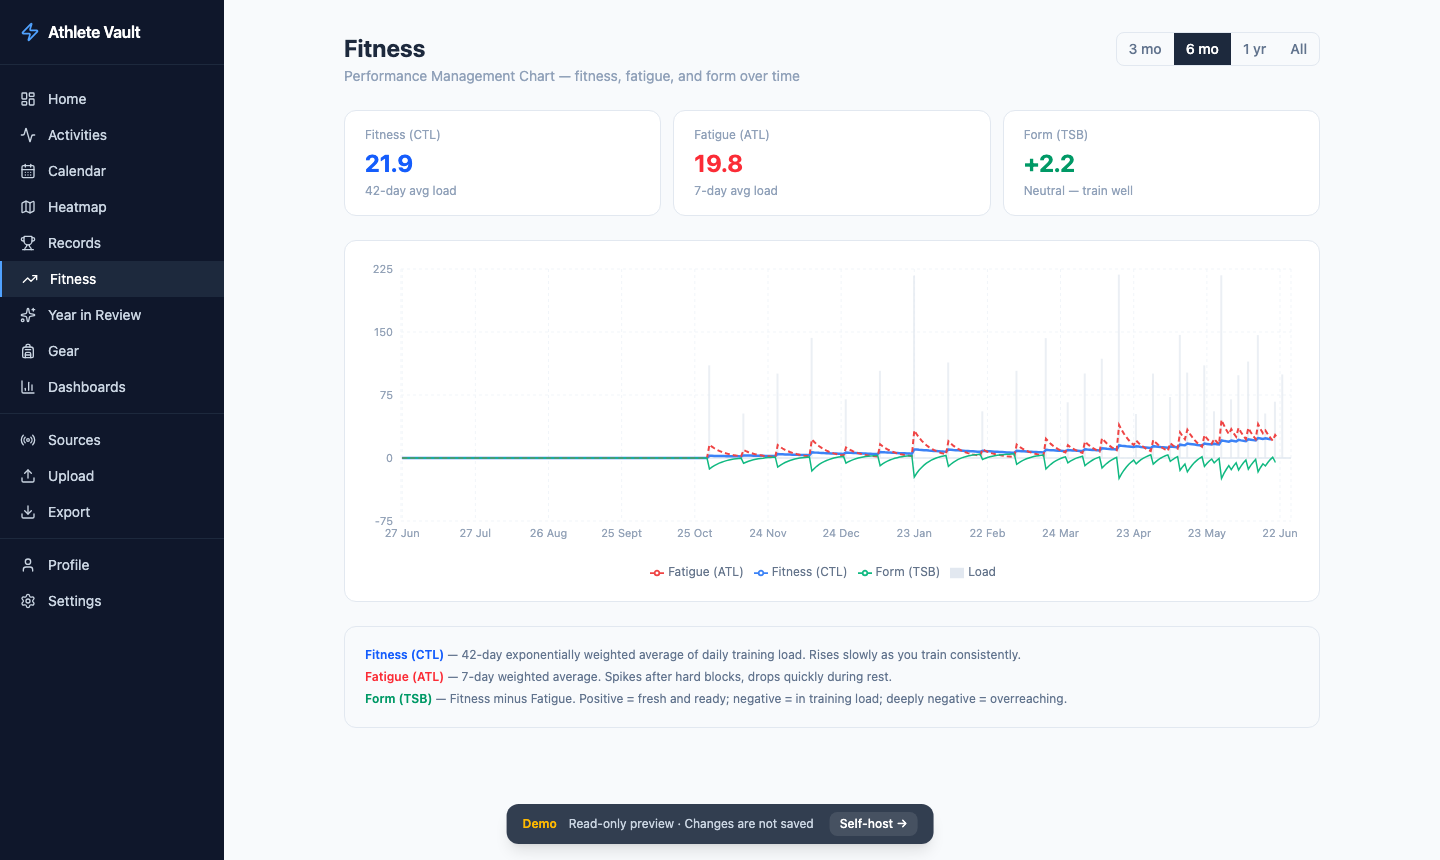
/fitness — the single most-requested feature by structured-training athletes.
Three lines plotted over time:
| Line | Colour | Meaning |
|---|---|---|
| CTL | Blue | Chronic Training Load — 42-day EWMA of daily TRIMP (proxy for fitness) |
| ATL | Red | Acute Training Load — 7-day EWMA (proxy for fatigue) |
| TSB | Green | Training Stress Balance = CTL − ATL (positive = fresh, negative = fatigued) |
TRIMP formula: duration_min × hr_ratio × e^(1.92 × hr_ratio) where hr_ratio = avg_hr / hr_max. Falls back to duration_min × 1.0 when HR data is absent.
Set your max heart rate in Settings to enable accurate TRIMP computation.
Personal Records
Auto-detects your best efforts at standard distances using a sliding window over GPS samples:
| Distance | |
|---|---|
| 400 m | 1 km |
| 1 mile | 5 km |
| 10 km | 15 km |
| Half Marathon | Marathon |
For each distance: best time, pace, date set, link to the activity. The progression chart shows how each PR has evolved over time.
Year in Review
/review — auto-generated annual summary, like "Year in Sport Wrapped".
- Hero stat — total distance for the year in large type
- Month bar chart — distance by month
- Stat grid — total time, elevation, activity count
- Biggest activity — the single longest activity of the year
- Most-used gear — the item with the most distance assigned
- Sport breakdown — donut chart by sport type
Use the year picker to navigate between years.
Dashboards
Build custom dashboards from a library of widgets. Each dashboard has its own drag-and-resize grid.
Available widgets
| Widget | Description |
|---|---|
| Stat card | Single metric (distance, activities, or time) for a chosen period |
| Bar chart | Any metric over time, grouped by day / week / month |
| Line chart | Pace or HR trend |
| Donut | Sport type breakdown by distance |
| Activity feed | Scrollable list of recent activities |
| Eddington number | Largest N where you have done ≥ N activities of ≥ N km |
| Personal record | Best time at a chosen distance |
Managing dashboards
- Create — click "Create dashboard", give it a name
- Add widget — click "+ Add widget", choose type and configure
- Rearrange — drag widgets; resize from the bottom-right corner
- Edit widget — click the ⚙ icon to change metric, period, or filter
- Delete — hover a widget for the × button
Gear
Track your equipment and how much distance you've put on each item.
Adding gear
- Open the Gear page → click Add gear
- Fill in name, type (shoe / bike / watch / other), brand/model, purchase date
- Set a distance alert in km — a warning appears when the total crosses it
Assigning gear to activities
Open any activity detail page. The stats section has a gear row with an + Add gear button. Check the items you used and save. Totals update immediately.
Retiring gear
Click the retire button on any item. Retired gear is hidden from the assignment picker but its history is preserved.
Export
Download a TCX zip of your activities for importing into Garmin Connect, TrainingPeaks, or other tools.
- Open the Export page
- Optionally set a date range and sport type filter
- Click Export — a background job packages the files
- Once complete, click Download
Export jobs persist across restarts. Queue multiple exports and download later.
Settings
| Setting | Description |
|---|---|
| Strava credentials | Client ID and secret for Strava OAuth (can also be set via .env) |
| Protomaps API key | For vector tile map styles (free tier available at protomaps.com) |
| Map style | Default map style for all maps |
| Route colour | Colour of the GPS track |
| Max heart rate | Used for TRIMP / CTL / ATL calculation; rule of thumb: 220 − your age |
| Units | Metric (km, m) or Imperial (mi, ft, mph) |
| Password protection | Enable a bcrypt-hashed password gate for the entire app — recommended when exposing beyond localhost |